"If you are working on something that you really care about, you don't have to be pushed. Remember, it's not how FAR but how WELL!" - Ruth O.
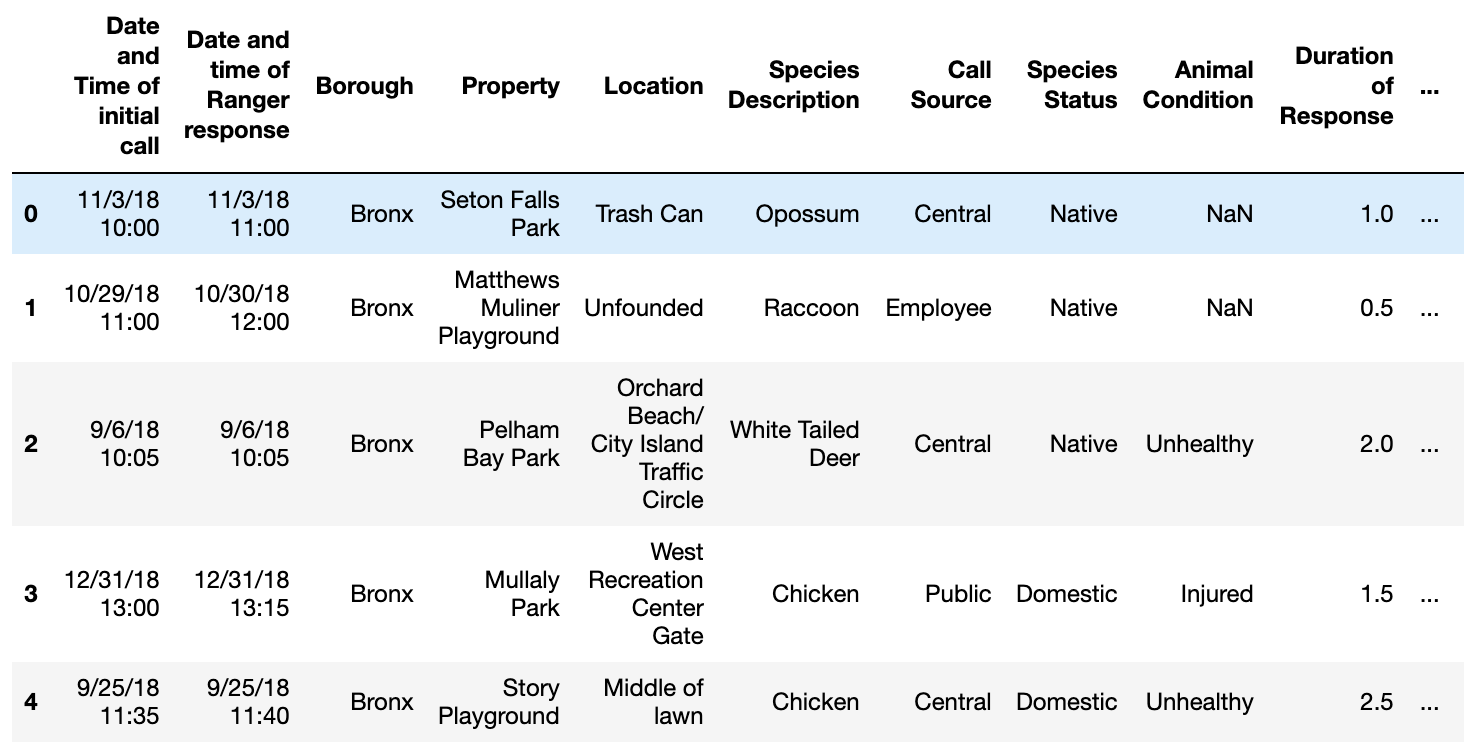
For our internship project we analyzed a data-frame which contains recorded information of wildlife living in New York City. During our analysis we observed trends, similarities and differences that presented themselves in the data. We were able to use qualitative and quantitative data to create visuals such as charts and graphs to present our findings. We believe our project would help bring awareness to those living in NYC and inform the public.
|
"Do not let anyone's doubts stop you from following your dreams!" - Melessa B. |
"I believe that anything is possible as long as you have the positive mindset and attitude about it." - Damaris D. |
|

|
|
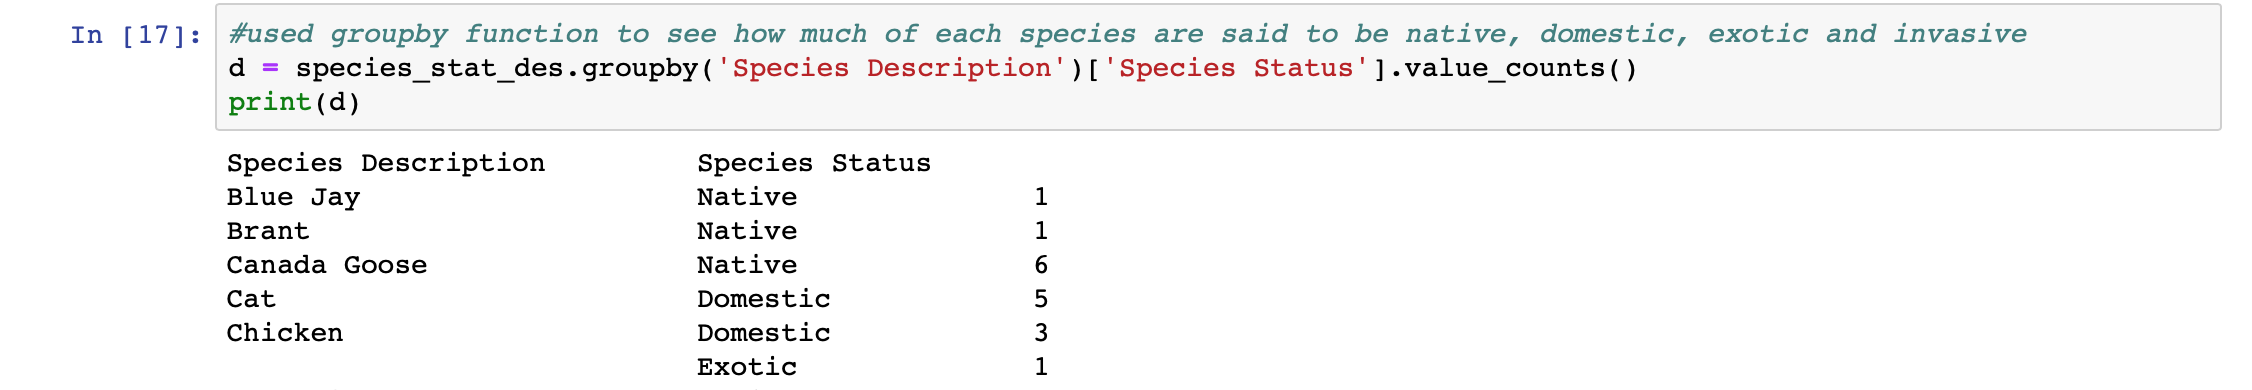
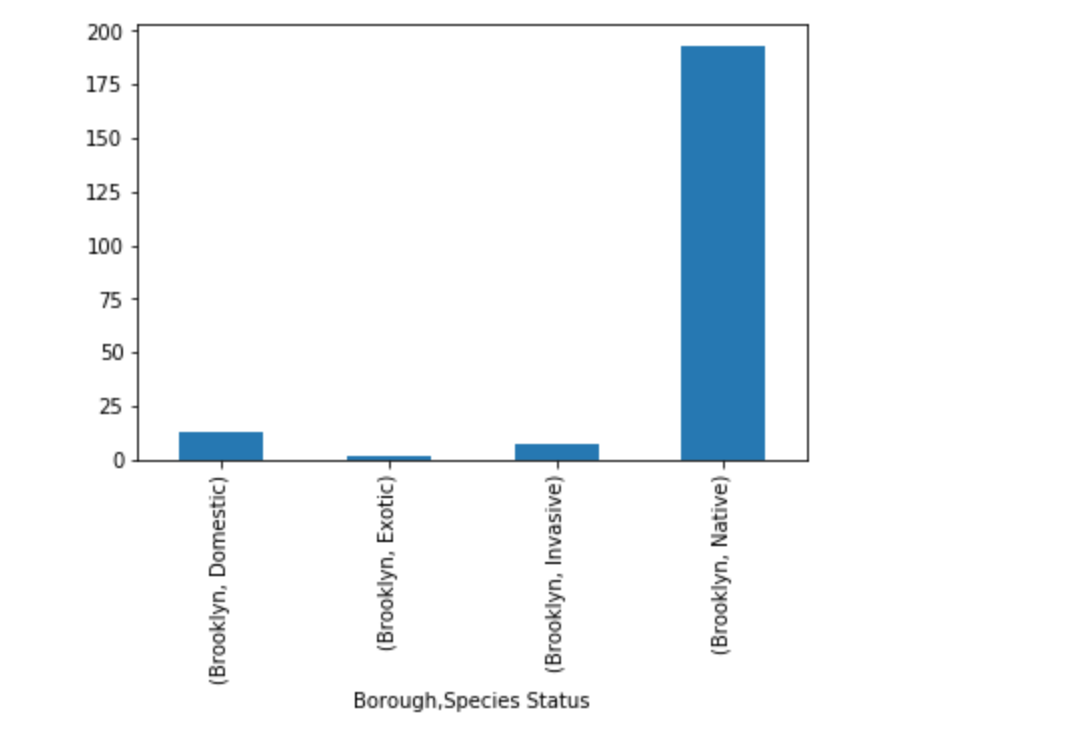
CODE: In this piece of code, I am grouping two columns together using the groupby function. This code will help us see how much of each species are native, domestic, exotic or invasive in the borough of Brooklyn. I believe this code is awesome because it informs us of the various species living in NYC and whether or not they are native here. |
This allows us to read csv files by converting it into panadas data frame. I thinks that this is a very important piece of code as it creates a data frame of information we are requered to know. |
|
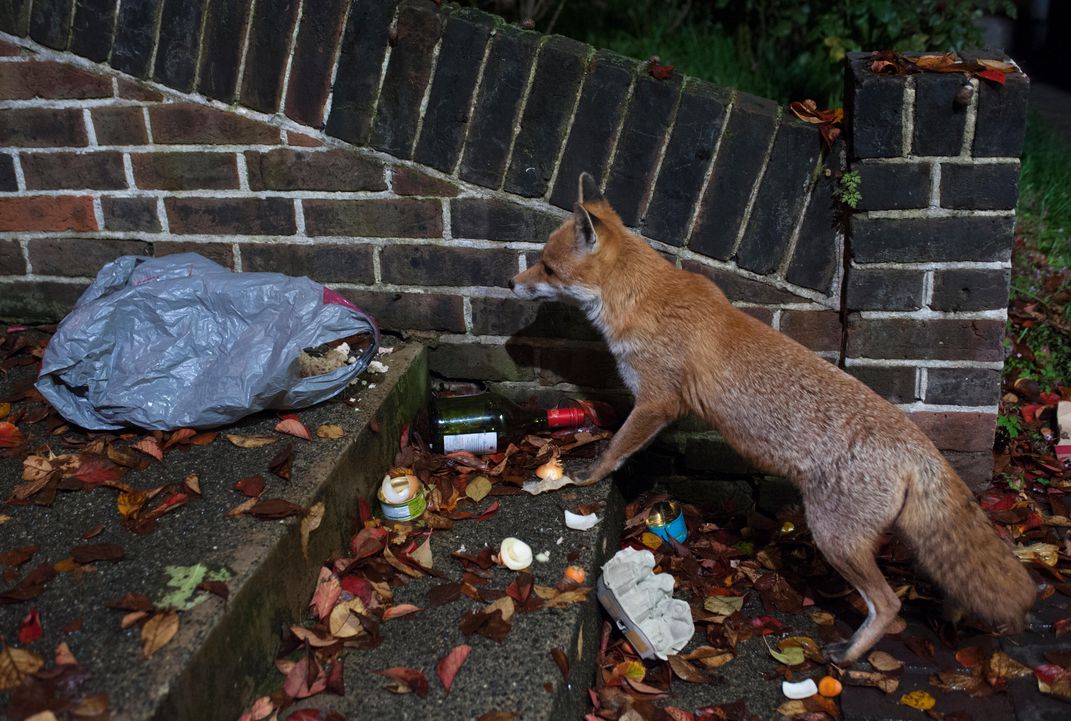
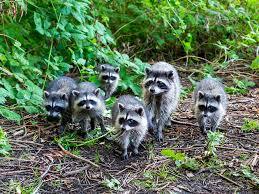
"There is abundant wildlife in New York City and hundreds of different species call the Big Apple home. From soaring hawks to curious coyotes, it's no surprise that my team and I had over 50+ species to classify!" |
|
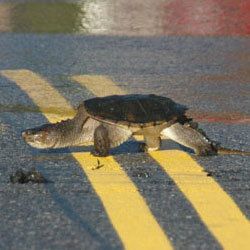
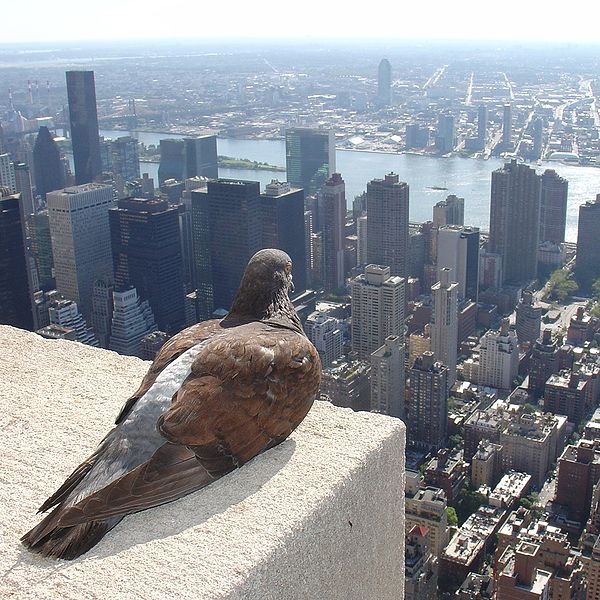
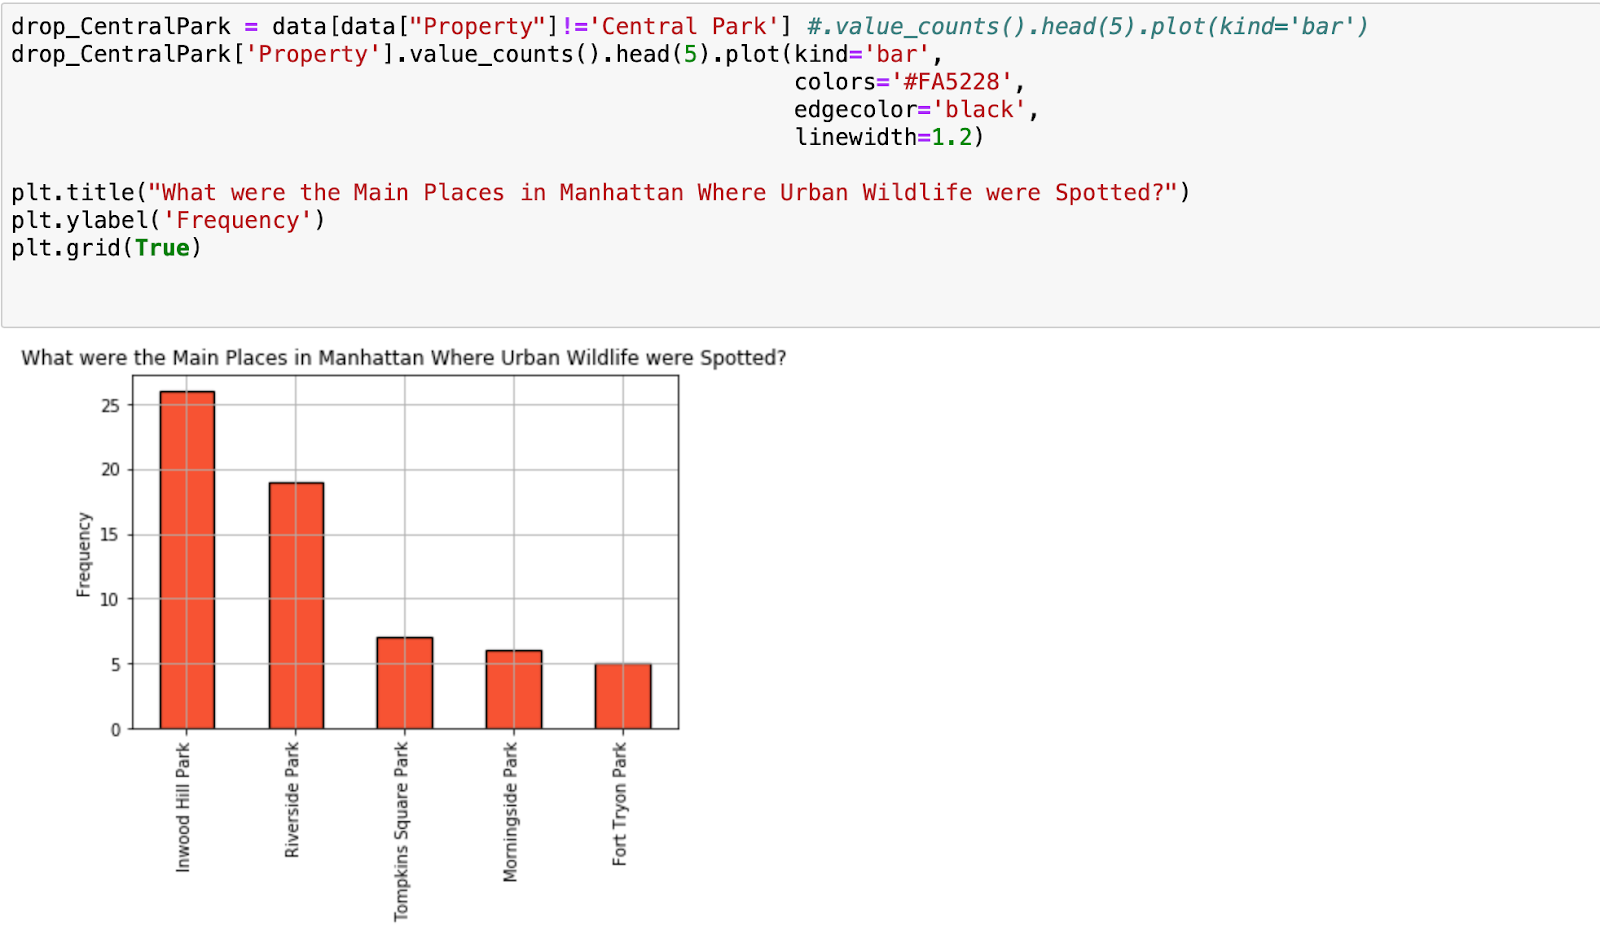
Did you know a coyote was seen numerous times just inside the park near West 82nd Street back in December 2019? With more than 600 species living in NYC, there are plentiful opportunities to witness these magnificent animals in their element, especially in Central Park. The code represents this visually; the bar graph shows the frequency of animals spotted in Manhattan sans Central Park to preserve the scale of the graph scale and to properly represent the data (Over 300 animals). |
|
|
"Due to the volume of our data Python Jupyter Notebook was used to analyze the data and make helpful data visualizations. As our aim was to accurately model the state of New York City's Wildlife, we feel we achieved our goal through the amalgamation of our statistics and data figures." |
|
Findings (Melessa B.)
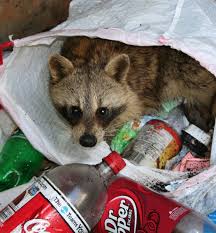
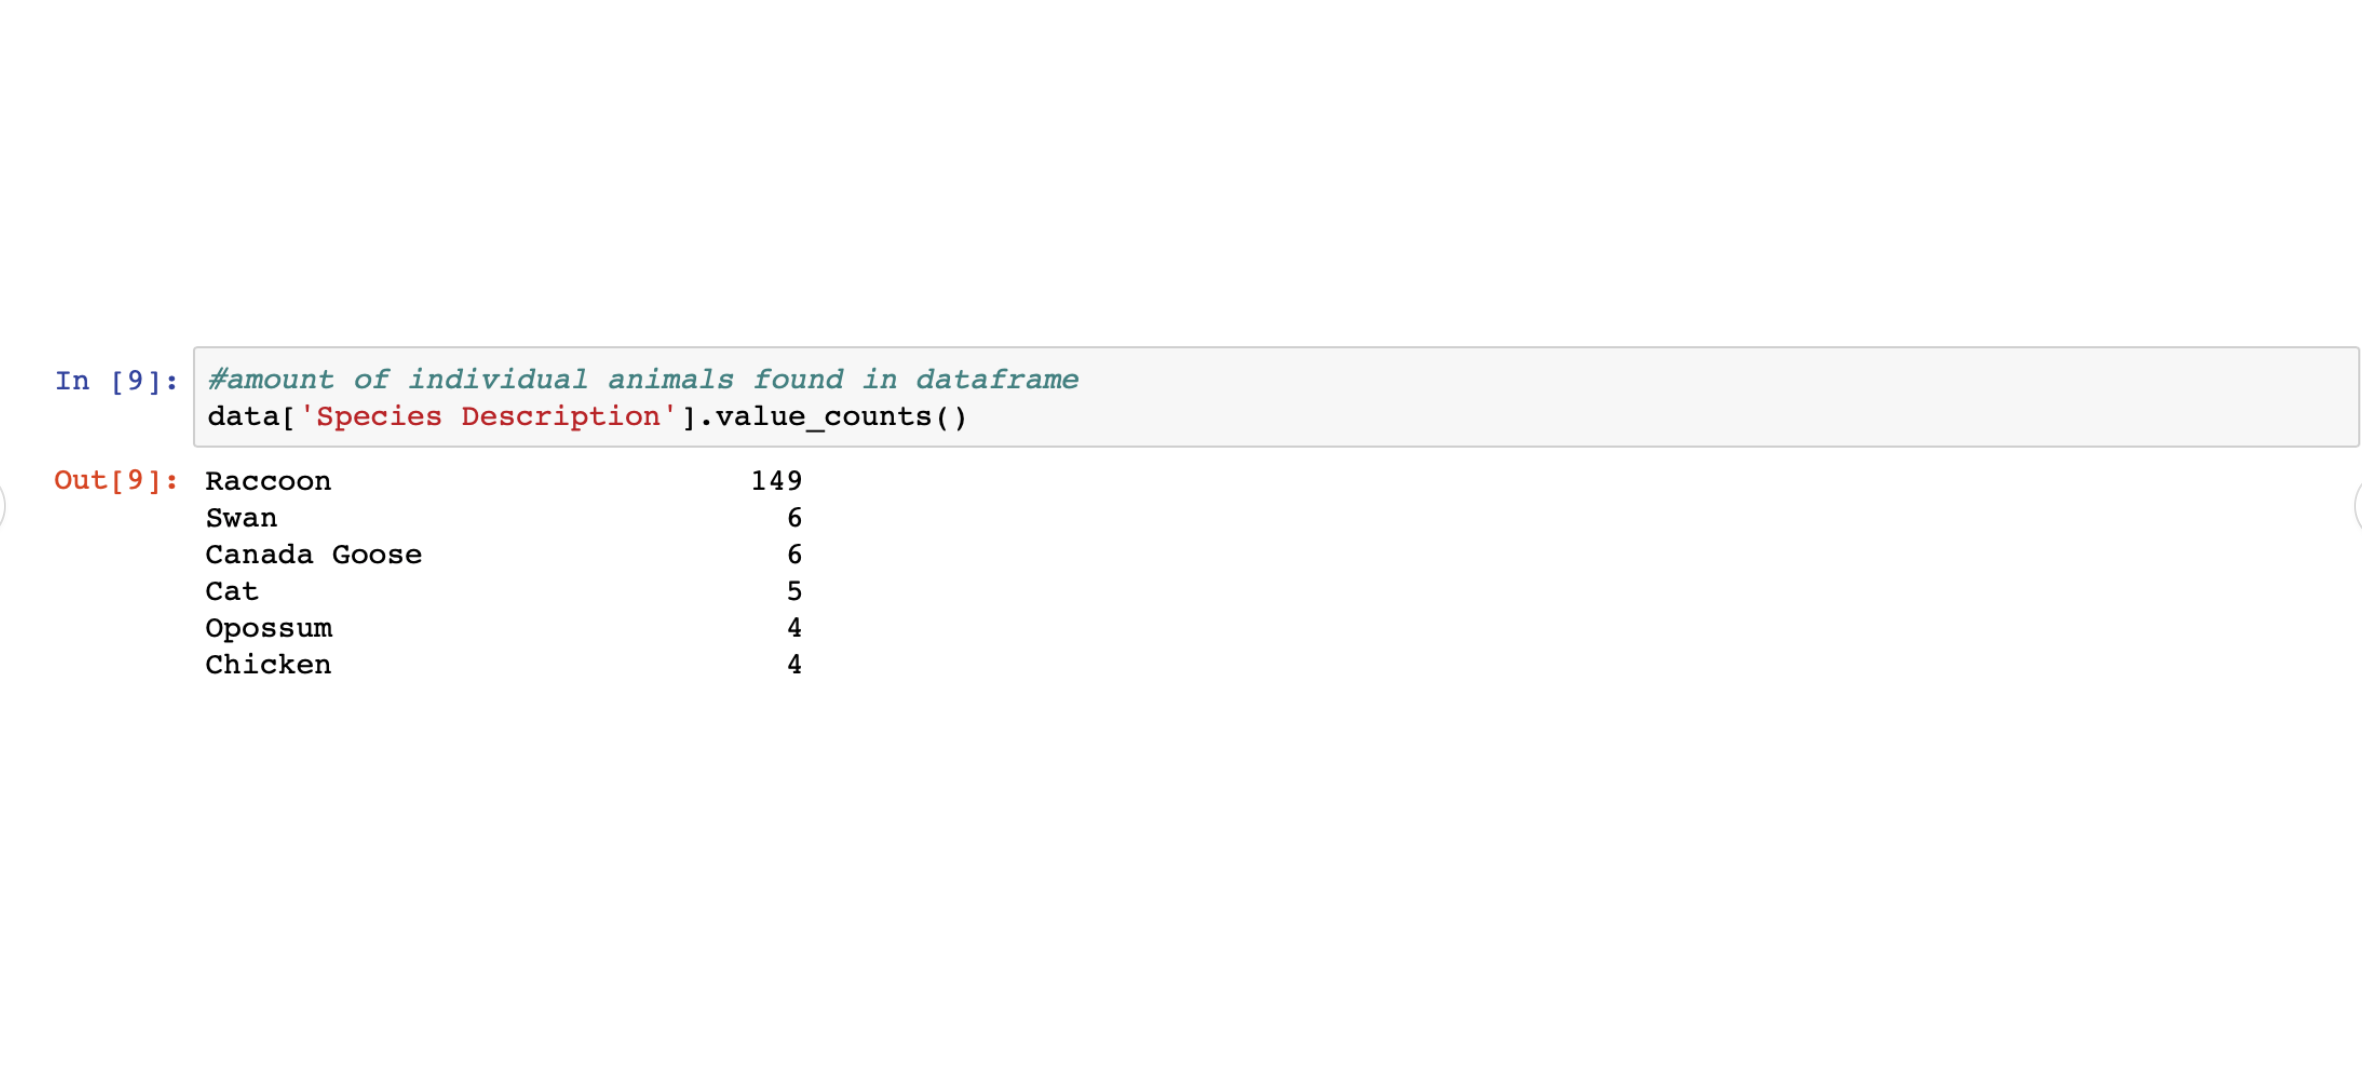
Here is screenshots of my data using jupyter notebook. The graph shows the value count of the species status in Brooklyn. From the graph its shows that there is more native animals in Brooklyn. The code supports my chart by showing that the highest recorded species population in Brooklyn is Raccoons.
Findings (Damaris D.)
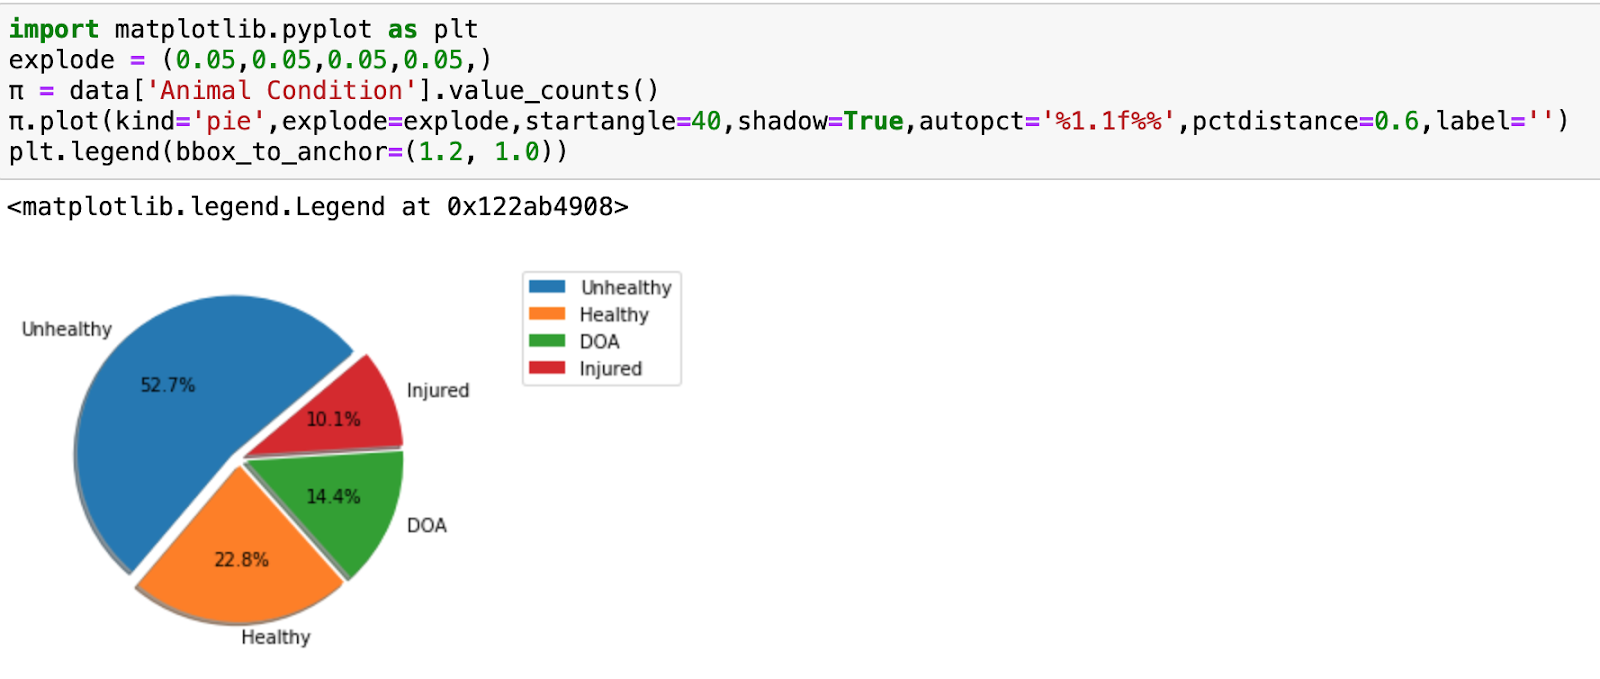
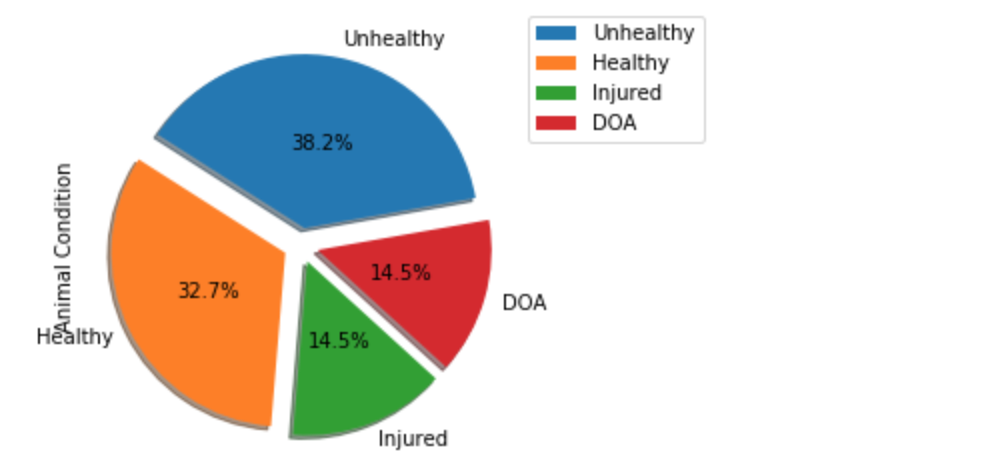
This graph shows the percentage of animals who are either unhealthy, healthy, injured, or DOA. This graph basically tells us that we must go more in depth into what is causing this animals to be injured or DOA.
Findings (Ruth O.)
Based on all our outputted visualizations, we reject our null hypothesis, and justify our findings through the research of Forman et al. in 2008. Forman et al. proposed that an animal's health may decline due to climate change, a prevalent and ongoing issue. Inasmuch, an animal's physical health can deteriorate because of climate change in four major wys: heat-related diseases and stress, extreme weather events, adaptation of animal production systems to new environments, and emergence or re-emergence of infectious diseases, especially vector-borne diseases (Forman et al., 2008).
Works Cited:
1. Forman, S., Hungerford, N., Yamakawa, M., Yanase, T., Tsai, H. J., Joo, Y. S., Yang, D. K., & Nha, J. J. (2008). Climate change impacts and risks for animal health in Asia. Revue scientifique et technique (International Office of Epizootics), 27(2), 581–597.